Trade Idea - Leveraged Single-Stock ETFs
For the past thirteen months, I've been building a portfolio of trading strategies from start to finish (from research to production trading). I was a researcher, developer, and trader. This job ended just a few days ago, but the search for alpha must live on! Typically, whenever I thought of a trading idea in the past, I'd relay it to the person I worked with. Given that I don't have any infrastructure to trade with at the moment and my dataset mainly consists of Yahoo Finance, I decided to share my thoughts with the world so that someone with access to infrastructure can have something fun to think about. So, here it goes.
Introduction To Leveraged Single-Stock ETFs
While recently reading Matt Levine's Money Stuff newsletter, which is always a fun read, I immediately became interested in leveraged single-stock ETFs (LSSEs). The idea is relatively simple: You have an underlying stock, and then you have a leveraged single-stock ETF, i.e., a tradable instrument where the only constituent is comprised of the underlying stock's derivatives to amplify the stock's returns. This is pretty cool, right? If a stock moves up by a magnitude of 20 basis points (bps), you should get returns of double-triple the scale, leaving you with 40-60 bps of return. However, this is in an ideal world, where trades within a given stock form a bijection with the trades that occur in their corresponding LSSE. Fortunately, this isn't the case–or else I'd have nothing to write about! People trade (and don't trade) for all sorts of reasons. Just because someone was to buy shares of, say, AAPL, does not necessarily mean that the LSSE for this instrument would immediately see a price change with double-triple the magnitude. Three things gave me immediate hope for an LSSE strategy:
- Their fair value is straightforward to price out (just watch the underlying stock!)
- They're relatively new to the industry, and
- They're filled with traders seeking a quick profit from a trending stock (i.e., a large portion of traders may not be trading with a legitimate edge, making the price deviate from its theoretical/fair value)
I did a little research and looked at some of the LSSEs by Direxion. I immediately noticed that the average daily volume for these funds sits within the 20-50 million dollar (USD) range. This made me think of two more things:
- There is probably a delay in the time that the stock's price moves and the time that the fund's price moves (due to the liquidity difference), and
- Accounting for trade-impact territory (roughly 10% of avg. daily volume), you're looking at 2-5 million dollars (USD) of room to trade with, something that most market-makers at big firms may often overlook
Research and Analysis
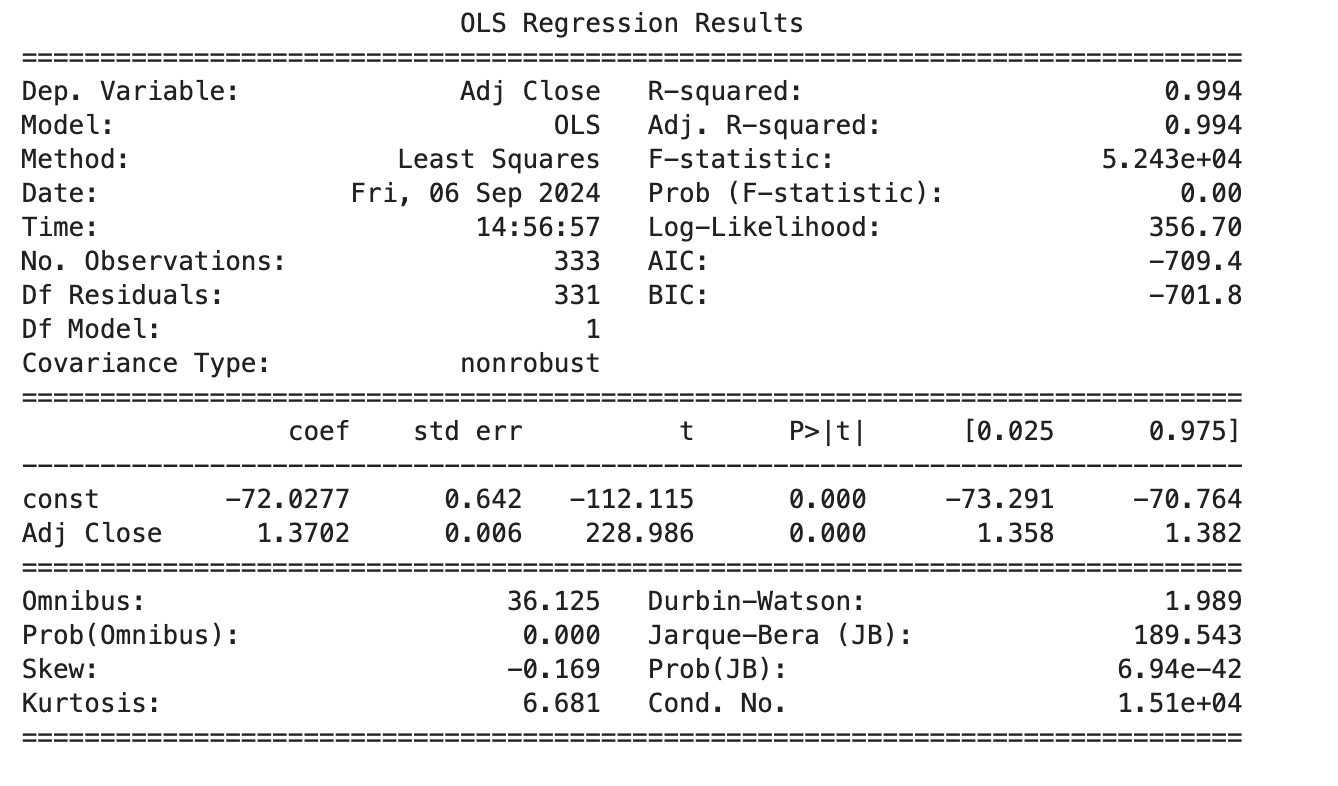
I picked a trendy stock, NVIDIA, and decided to dig a bit deeper and analyze Yahoo Finance minute bars (given that I don't have access to low latency infrastructure anymore, minute bars are about as granular as I could get). The first thing I did was download a day's worth of minute data for NVDU (Direxion Daily NVDA Bull 2X Shares) and quickly eyeballed-it, i.e., run an ordinary least squares (OLS) regression between NVDA and NVDU to ensure that the r-squared met a certain threshold.
This step seemed promising, so I moved on to calculating the spread between the fund's price percentage change and its underlying stock percentage change. This was calculated as follows: (price percentage change for NVDU) / (price percentage change for NVDA). I calculated the spread this way because it is known that NVDU seeks to reflect 200% of the performance to that of NVDA, so the spread should sit between one and two (e.g., if NVDA moves up by 30 bps (0.03%), then NVDU should move up by roughly 60 bps (0.06%).
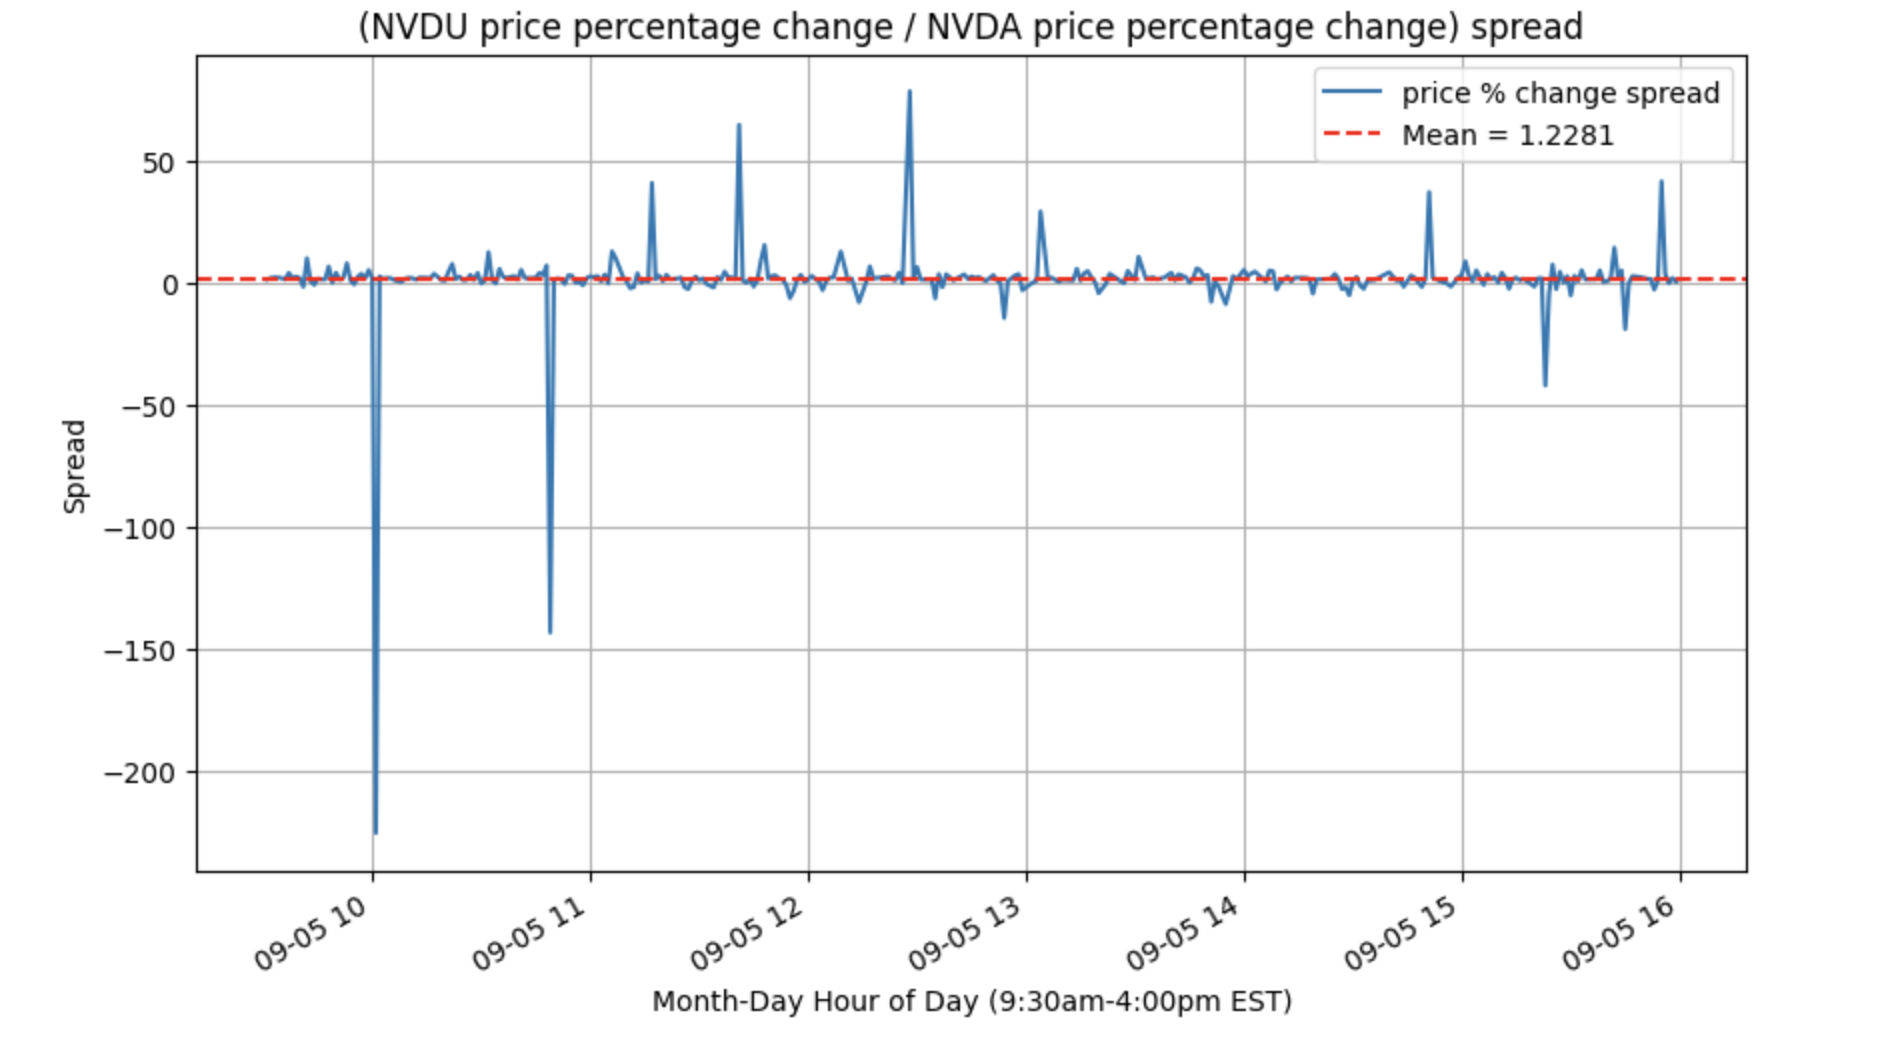
Visually speaking, this spread looks incredibly stationary, and it's comforting to see the mean spread value sits within the one-to-two range. It's also worth mentioning that there are some clear outliers (prospective trade opportunities!). To confirm, I ran an Augmented Dickey-Fuller (ADF) Test, i.e., a statistical test to determine whether a unit root exists within a time series. If the p-value is below 0.05 (5%), we can confidently reject that null hypothesis and say that the given time series is stationary. Here are the results of the spread's ADF test:
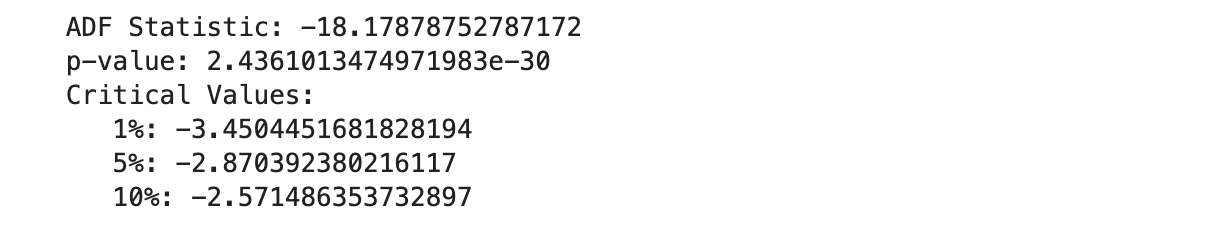
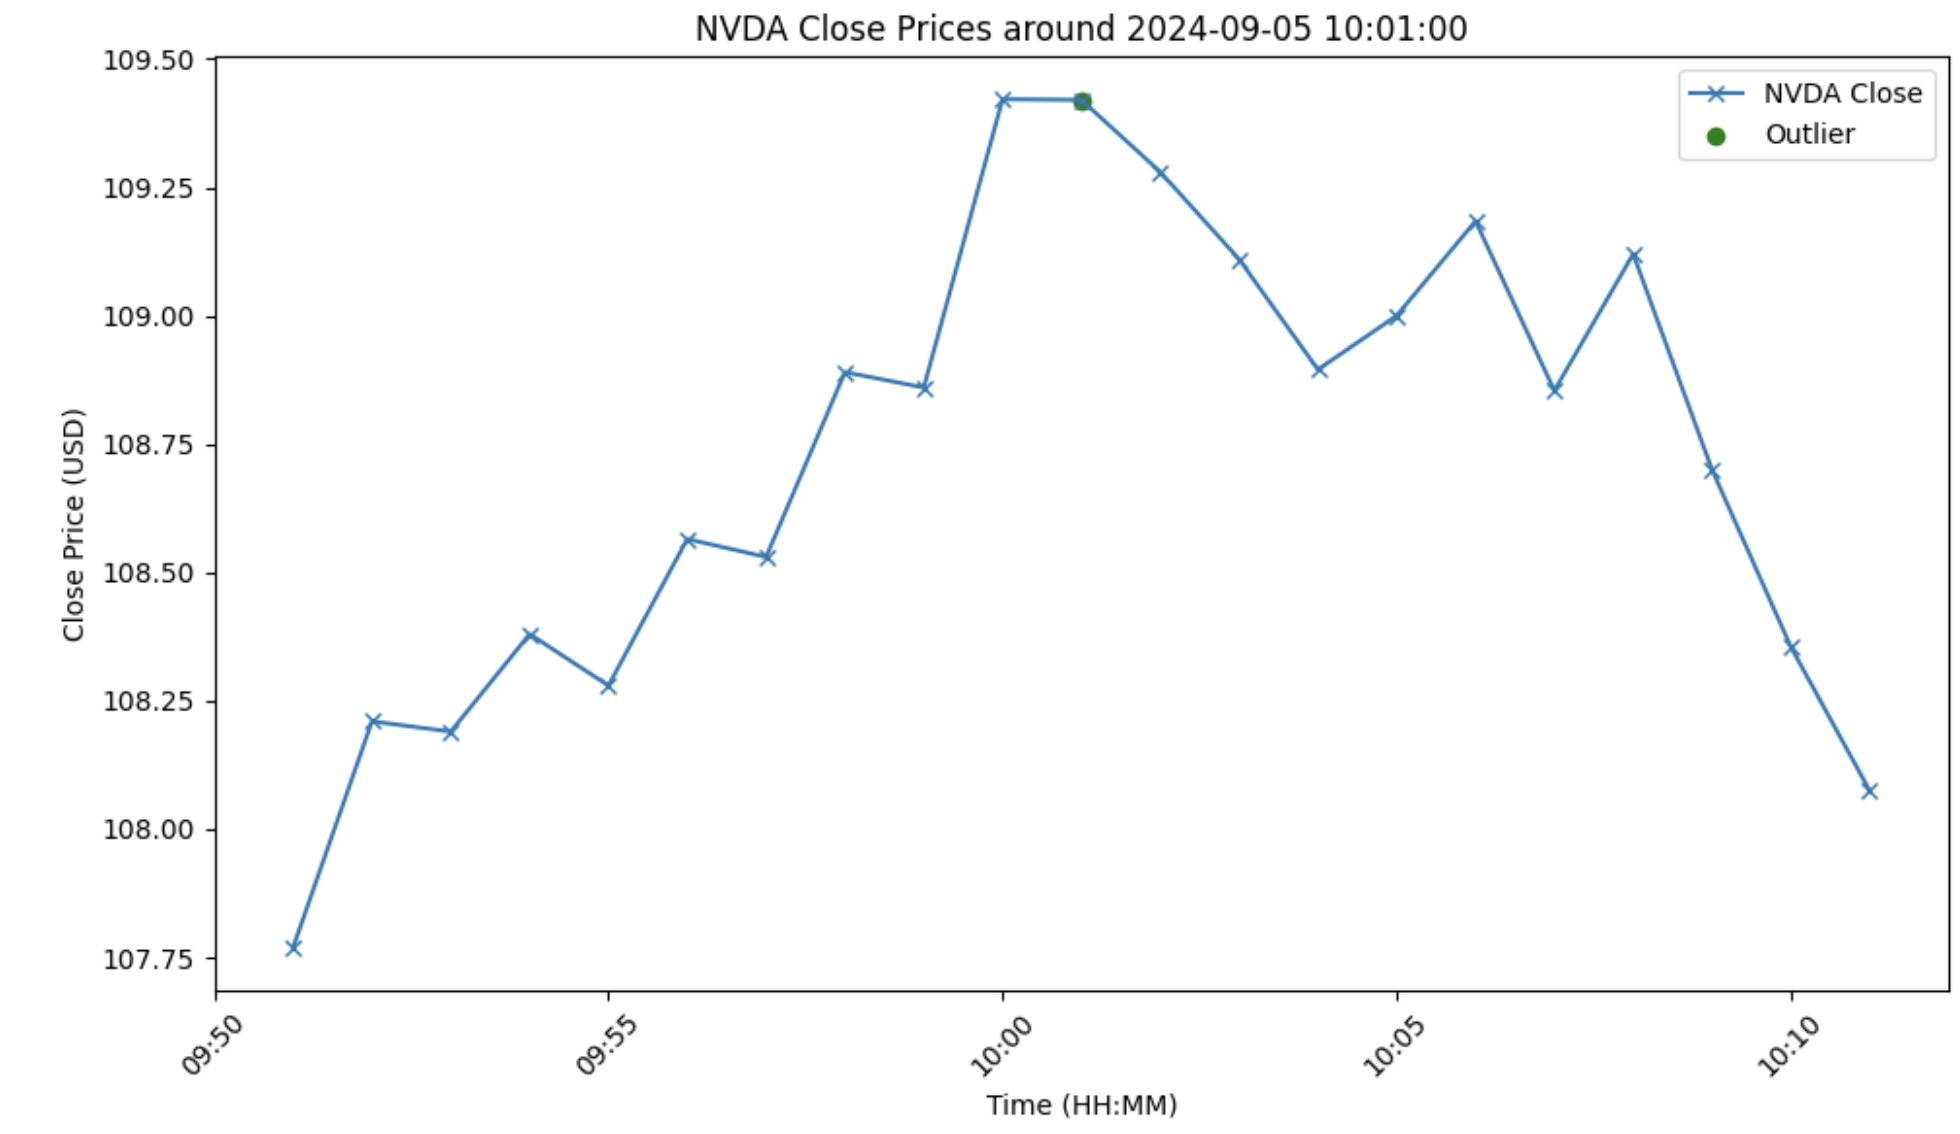
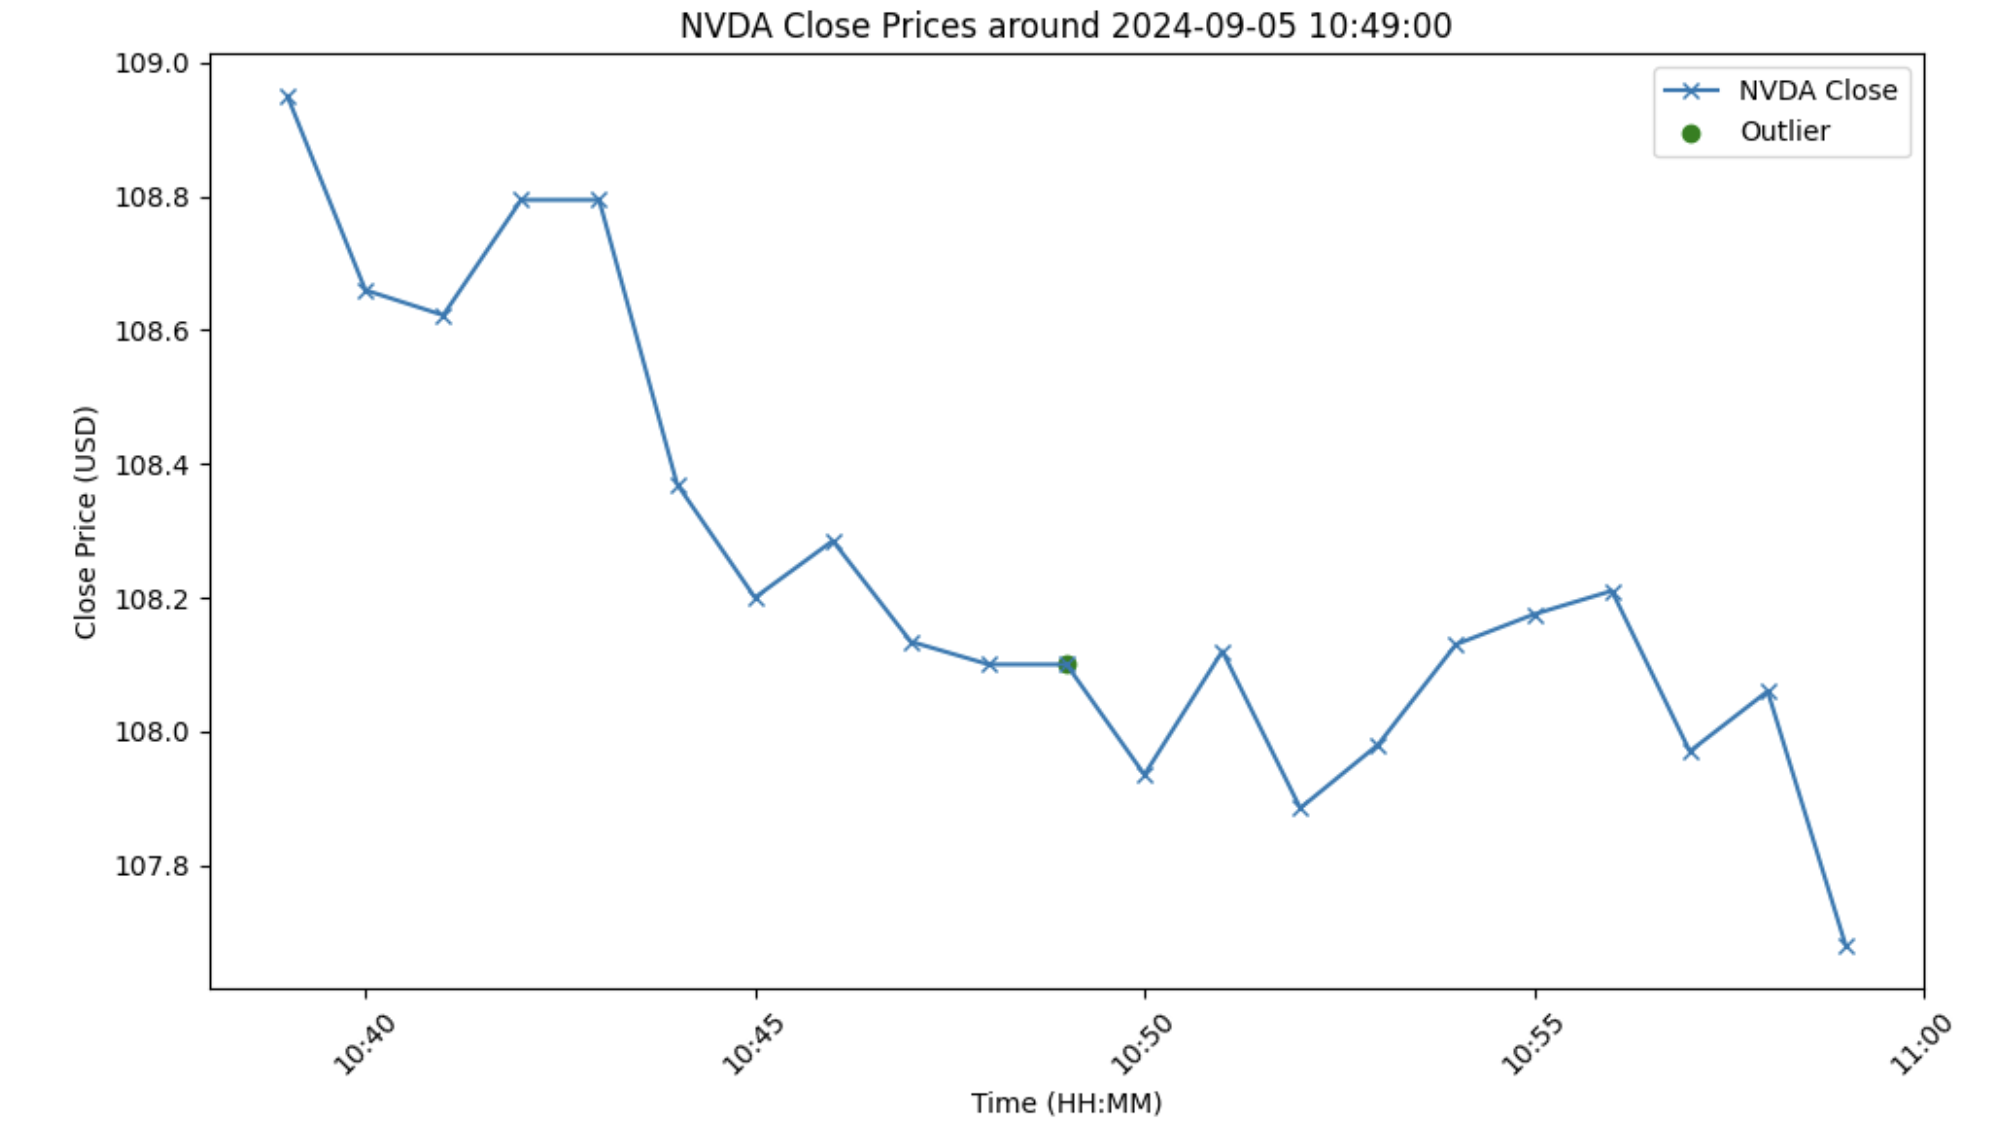
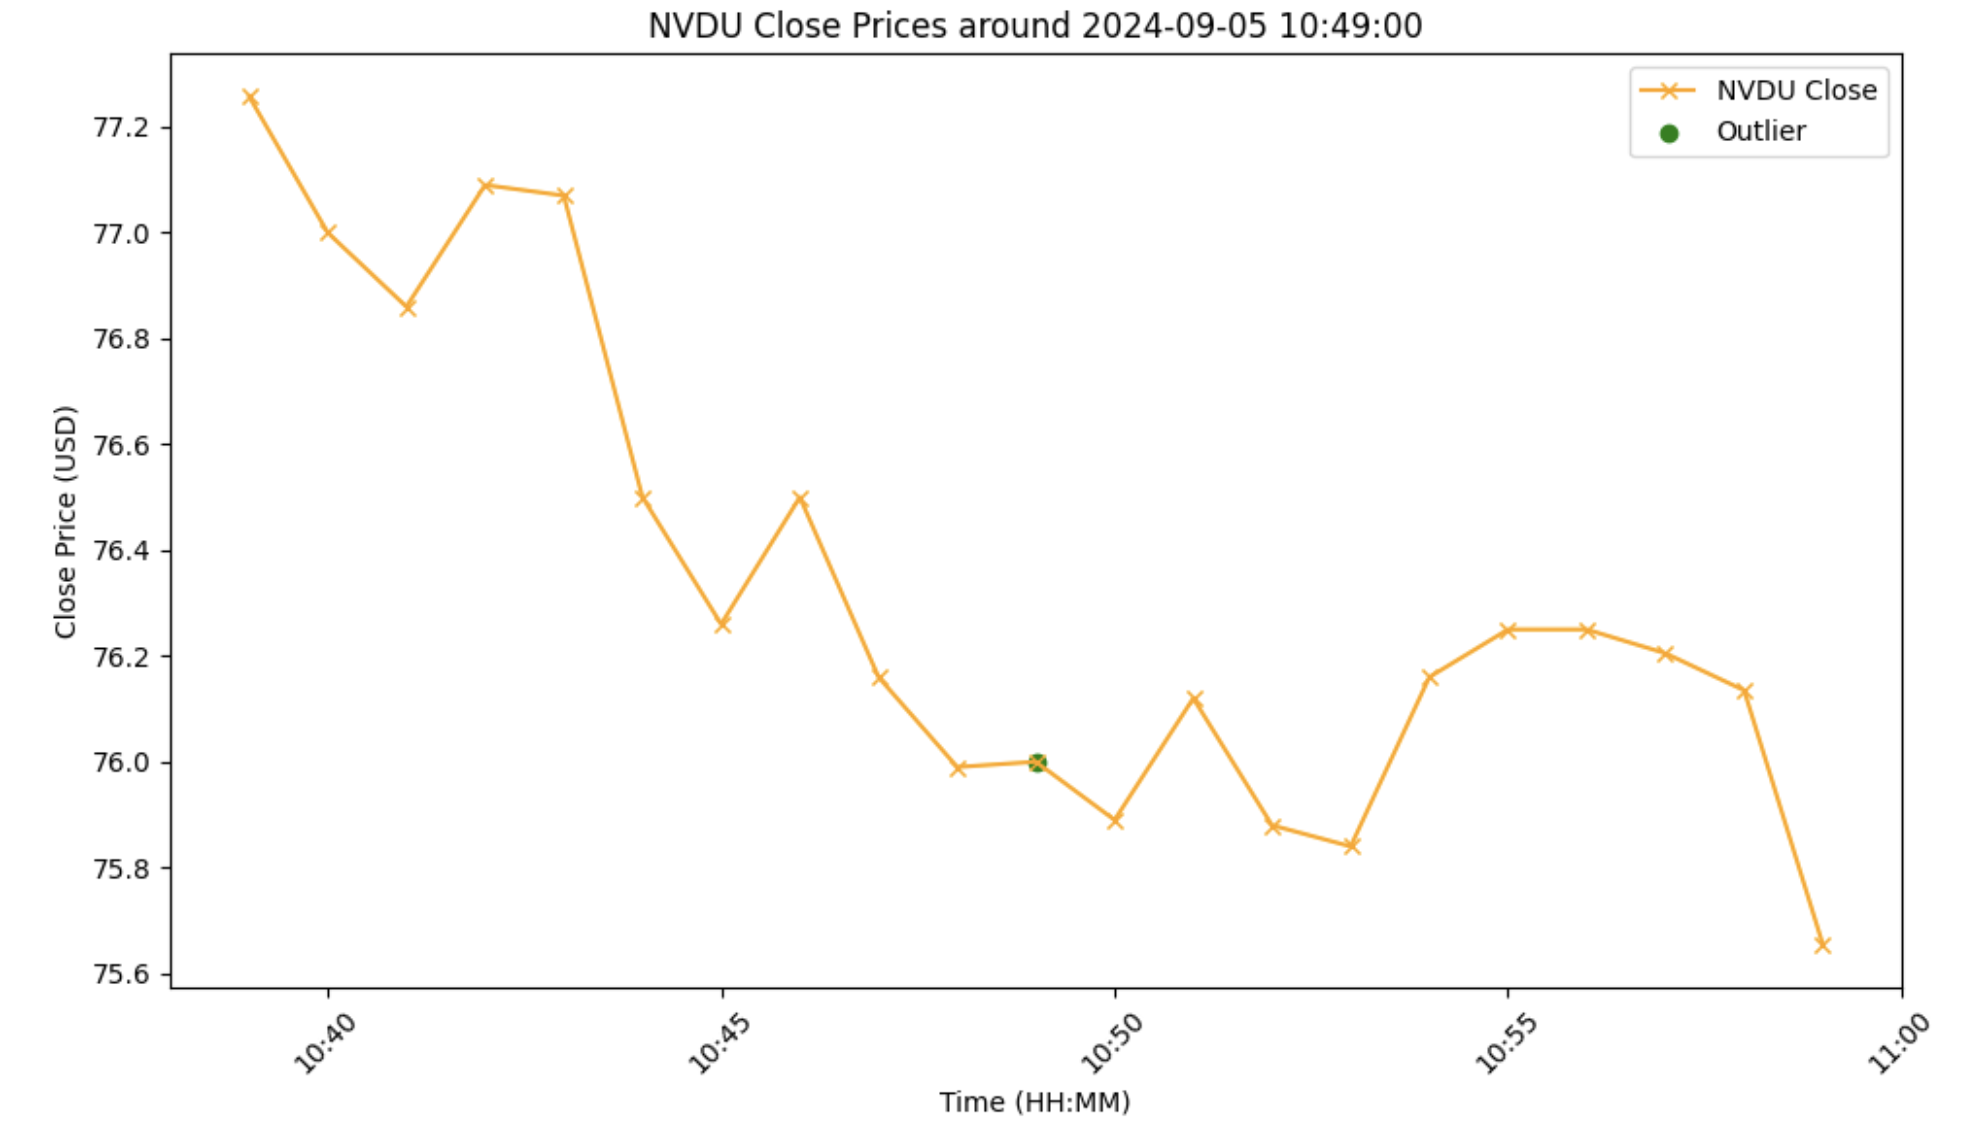
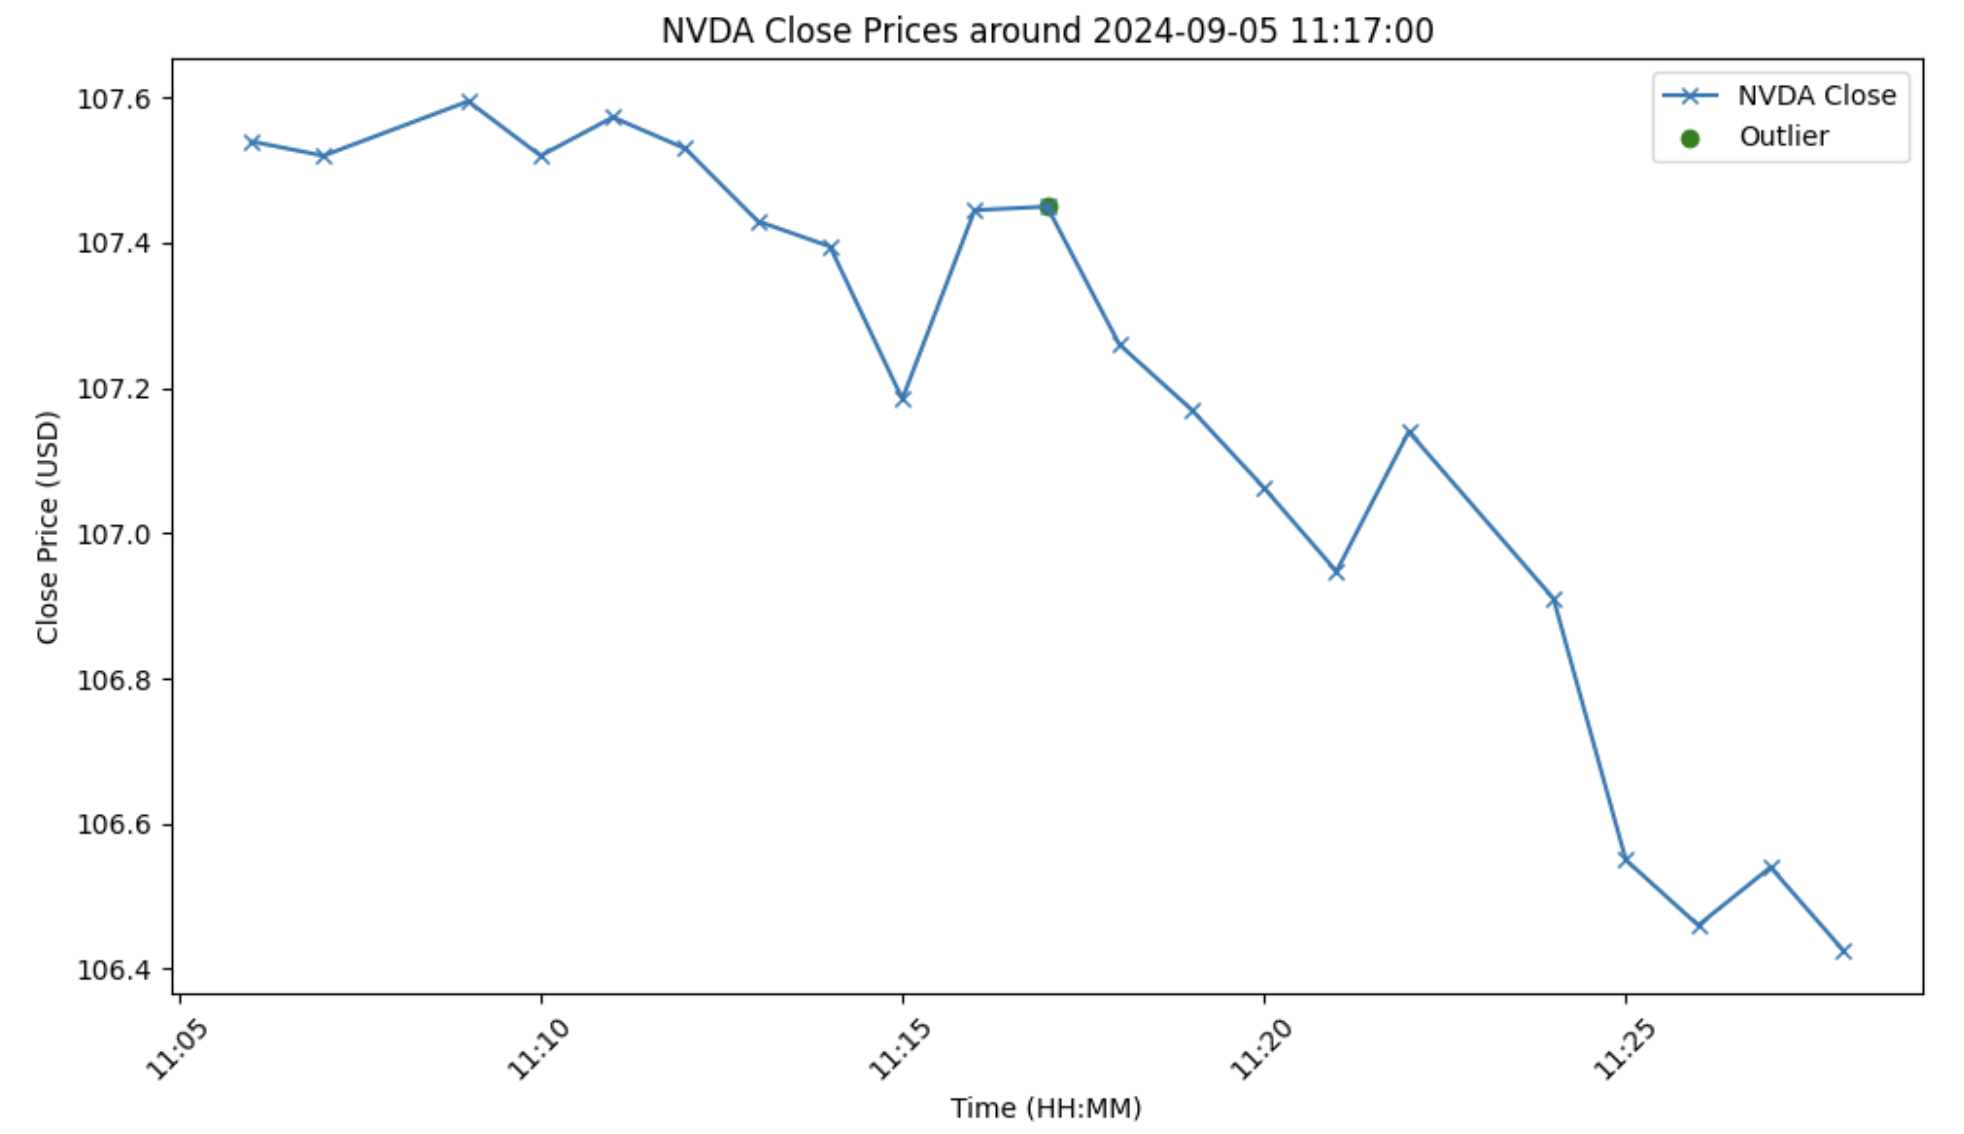
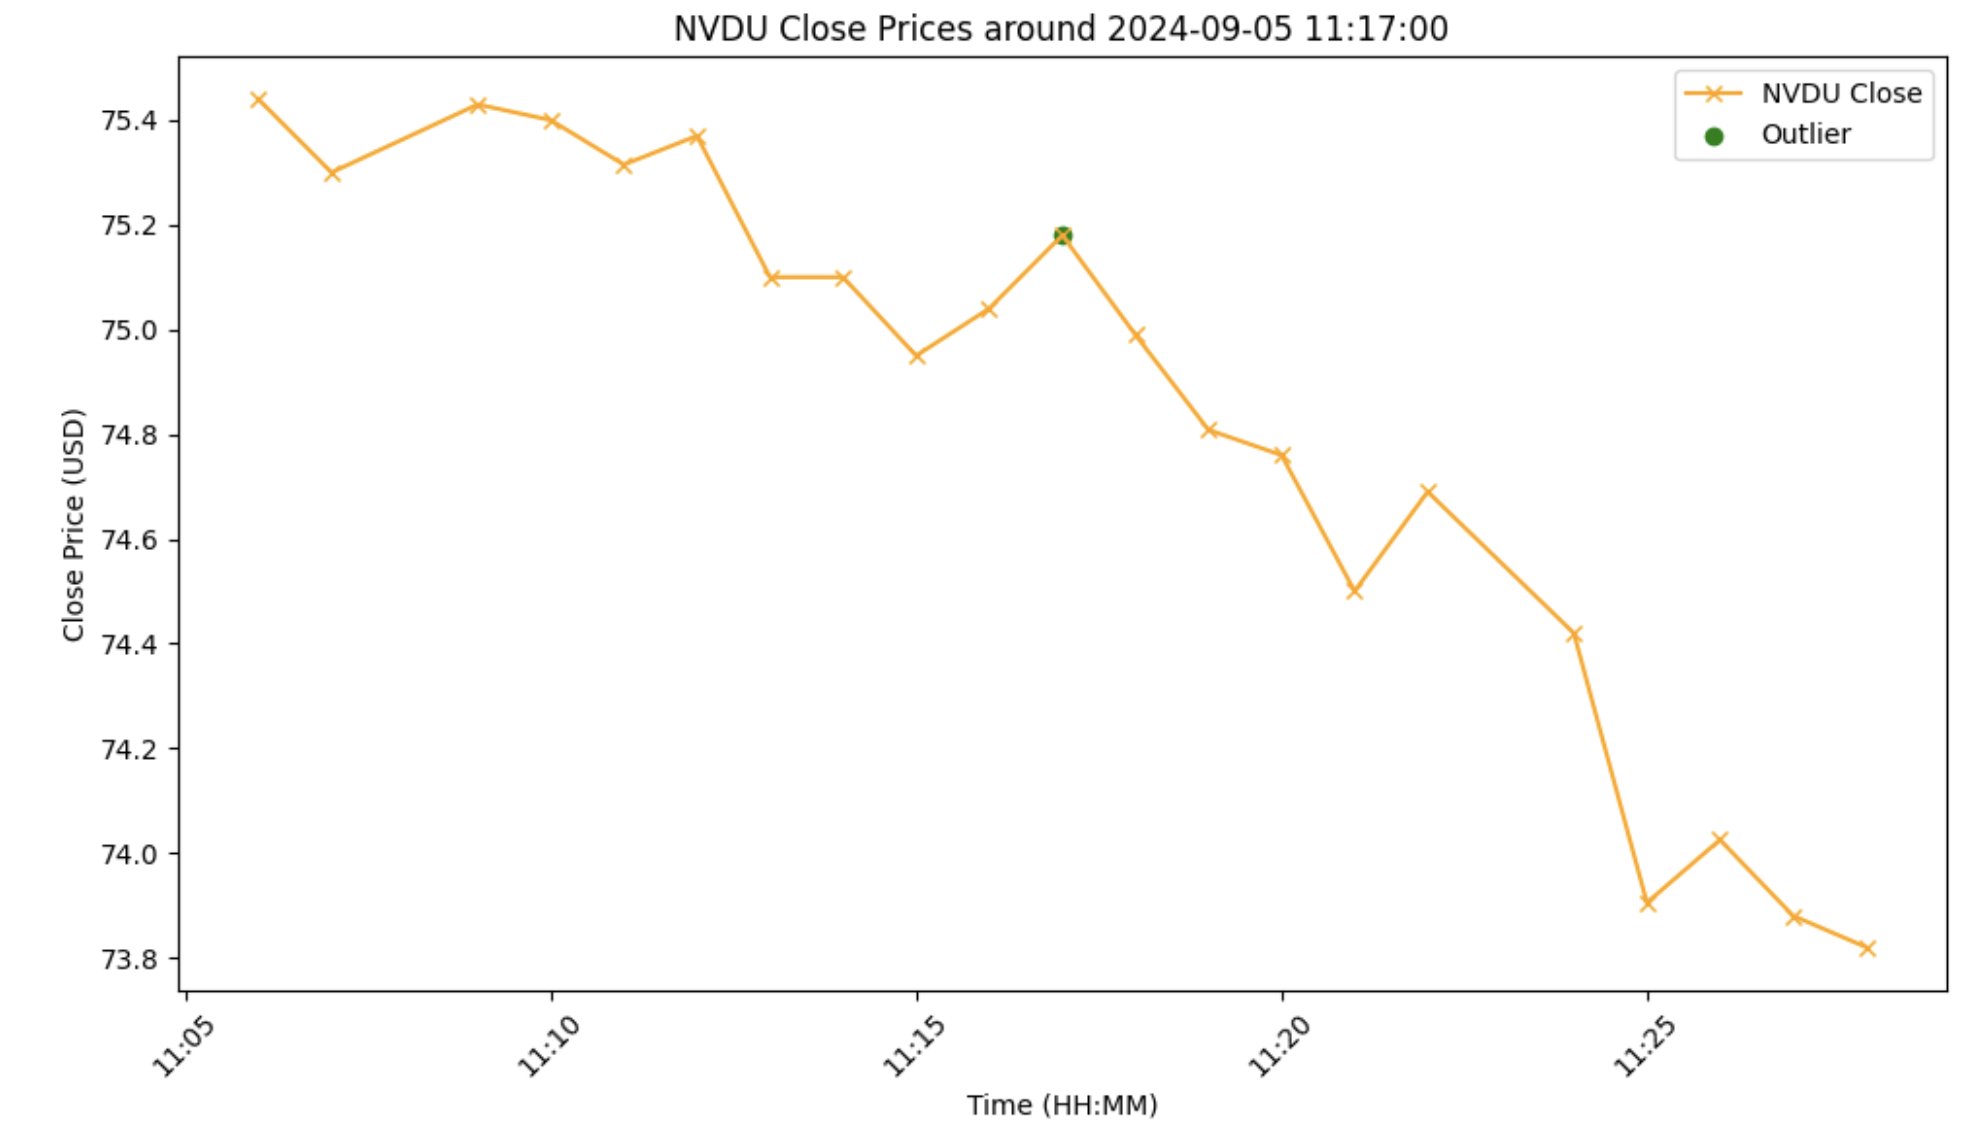
Very promising! Next, I took z-scores (+/- 2 standard deviations) over the mean of the spread and filtered for the spread outliers. I was able to find eight significant outliers. After this, I looked at a 20-minute neighborhood around the outlying minute in NVDA and NVDU's minute close prices to try and visualize this price change discrepancy between the two instruments. This neighborhood was calculated as follows: All minute bars within plus-and-minus 10 minutes of the time of the outlying event, inclusive of the outlying event. Here is what the first three outlying 20-minute event neighborhoods look like:
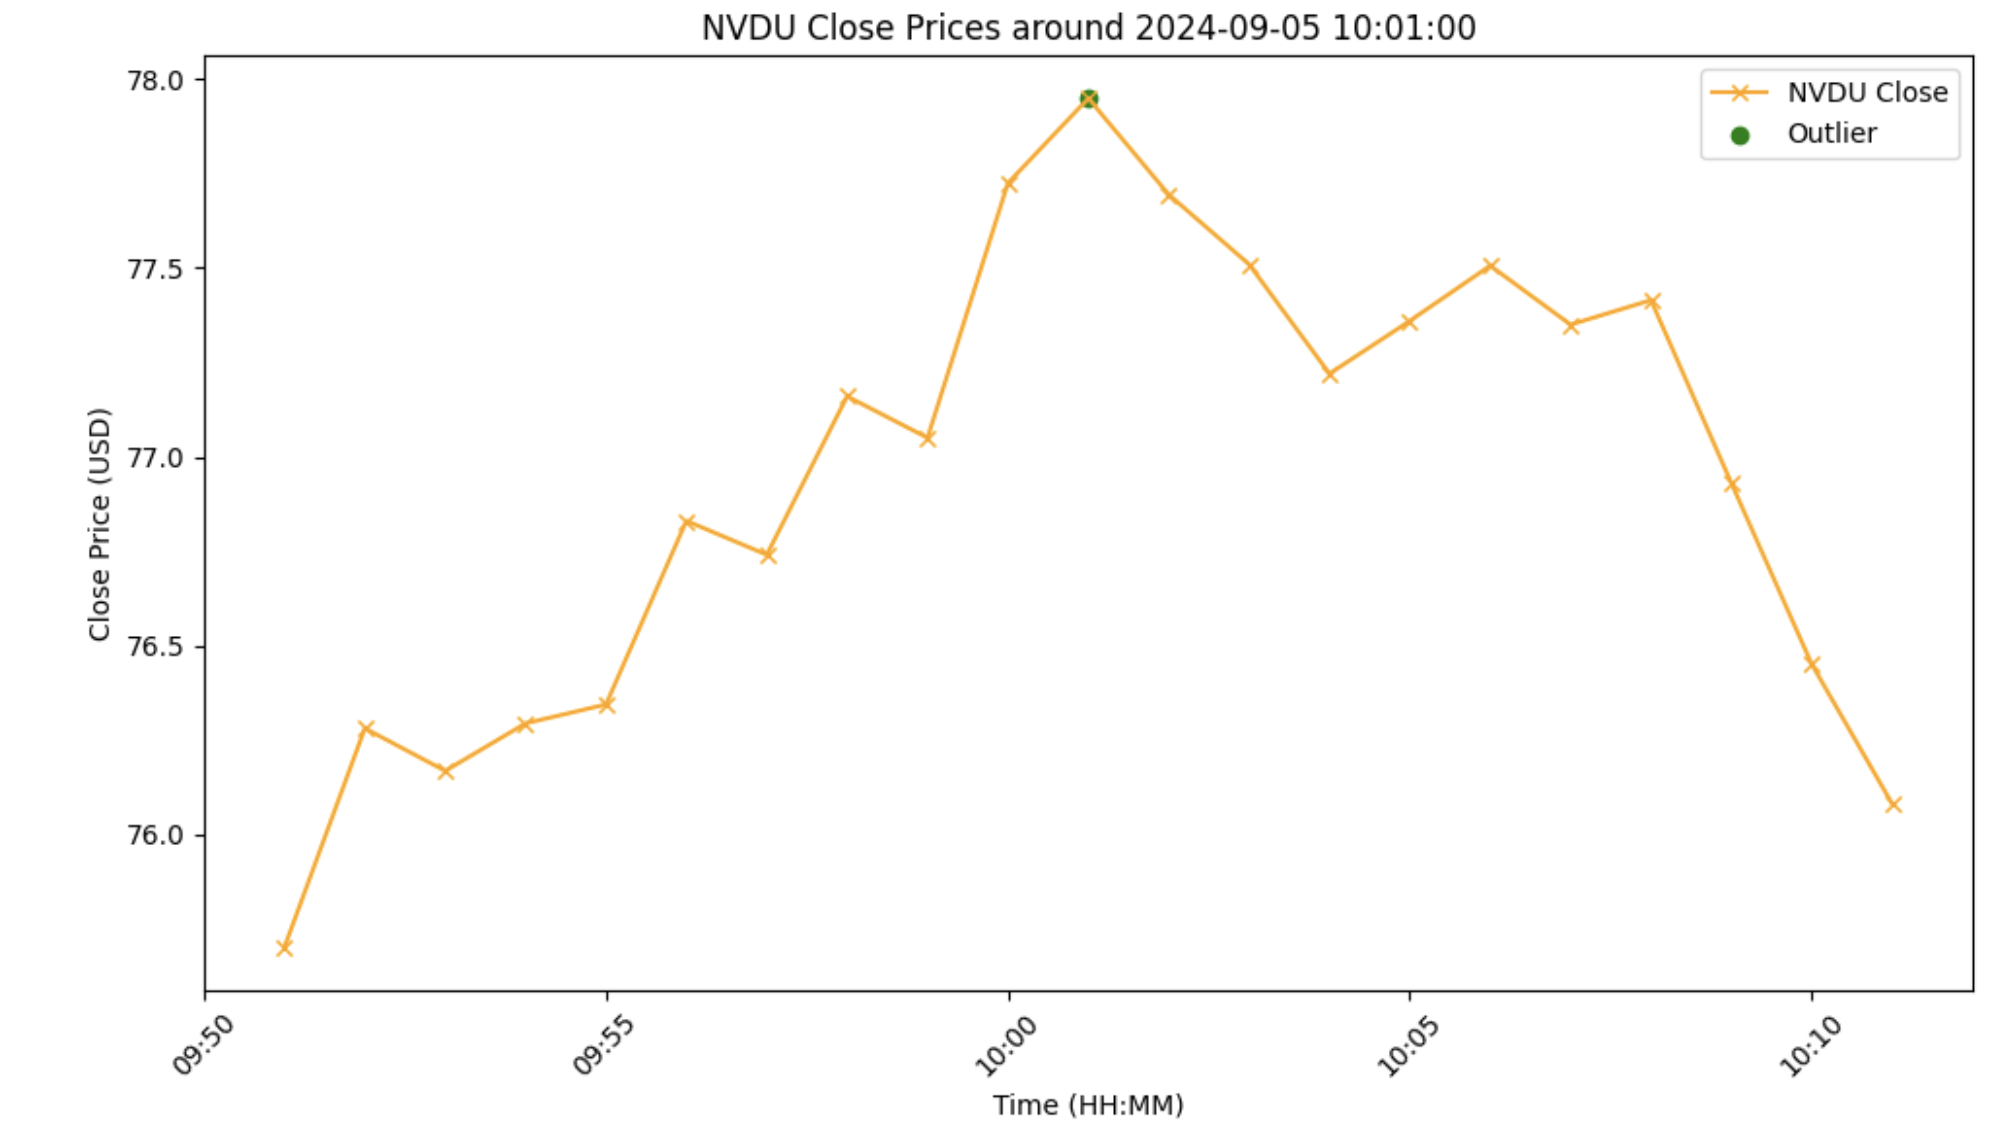
Conclusion
It is obvious that there are statistical arbitrage opportunities within all three of these outlying events. Given that eight clear outlying events are found in a single day's worth of minute data, I wouldn't be surprised to see many more outlying events in quote/trade data. Now, it would feel wrong to continue developing a complete backtest using only close prices from minute bars. However, I think a deep dive into the Securities Information Processors (SIP) feed would certainly answer some more fundamental questions about this trade. We would be able to see exactly how long these price discrepancies last for, as well as how much volume is traded within these "lag" periods. Another thing worth analyzing is the borrowing costs to go short on these LSSEs, as well as trading fees on this trade in general. I think there may be a signal here for someone with access to mid-low latency and mid-high frequency infrastructure. The trade is quite simple and may even allow for a nice market-making strategy as opposed to a taking strategy if the bid-ask spread in the LSSE is wide enough at times (again, this would require more granular data to find out).
Overall, I'm confident that this could produce appealing results. However, as this is simply the tip of the iceberg in researching this trade, much more work is needed to determine its legitimacy and scalability.
On second thought, maybe a better and longer-lasting signal would be to build an NLP web/email scraper that scrapes the Money Stuff newsletter the second it comes out, and extracts trade ideas from it (I'm only partly joking).